
Geospatial, Earth Observation, and AI specialists working with you to harness the full potential of natural assets.
Our Capabilities
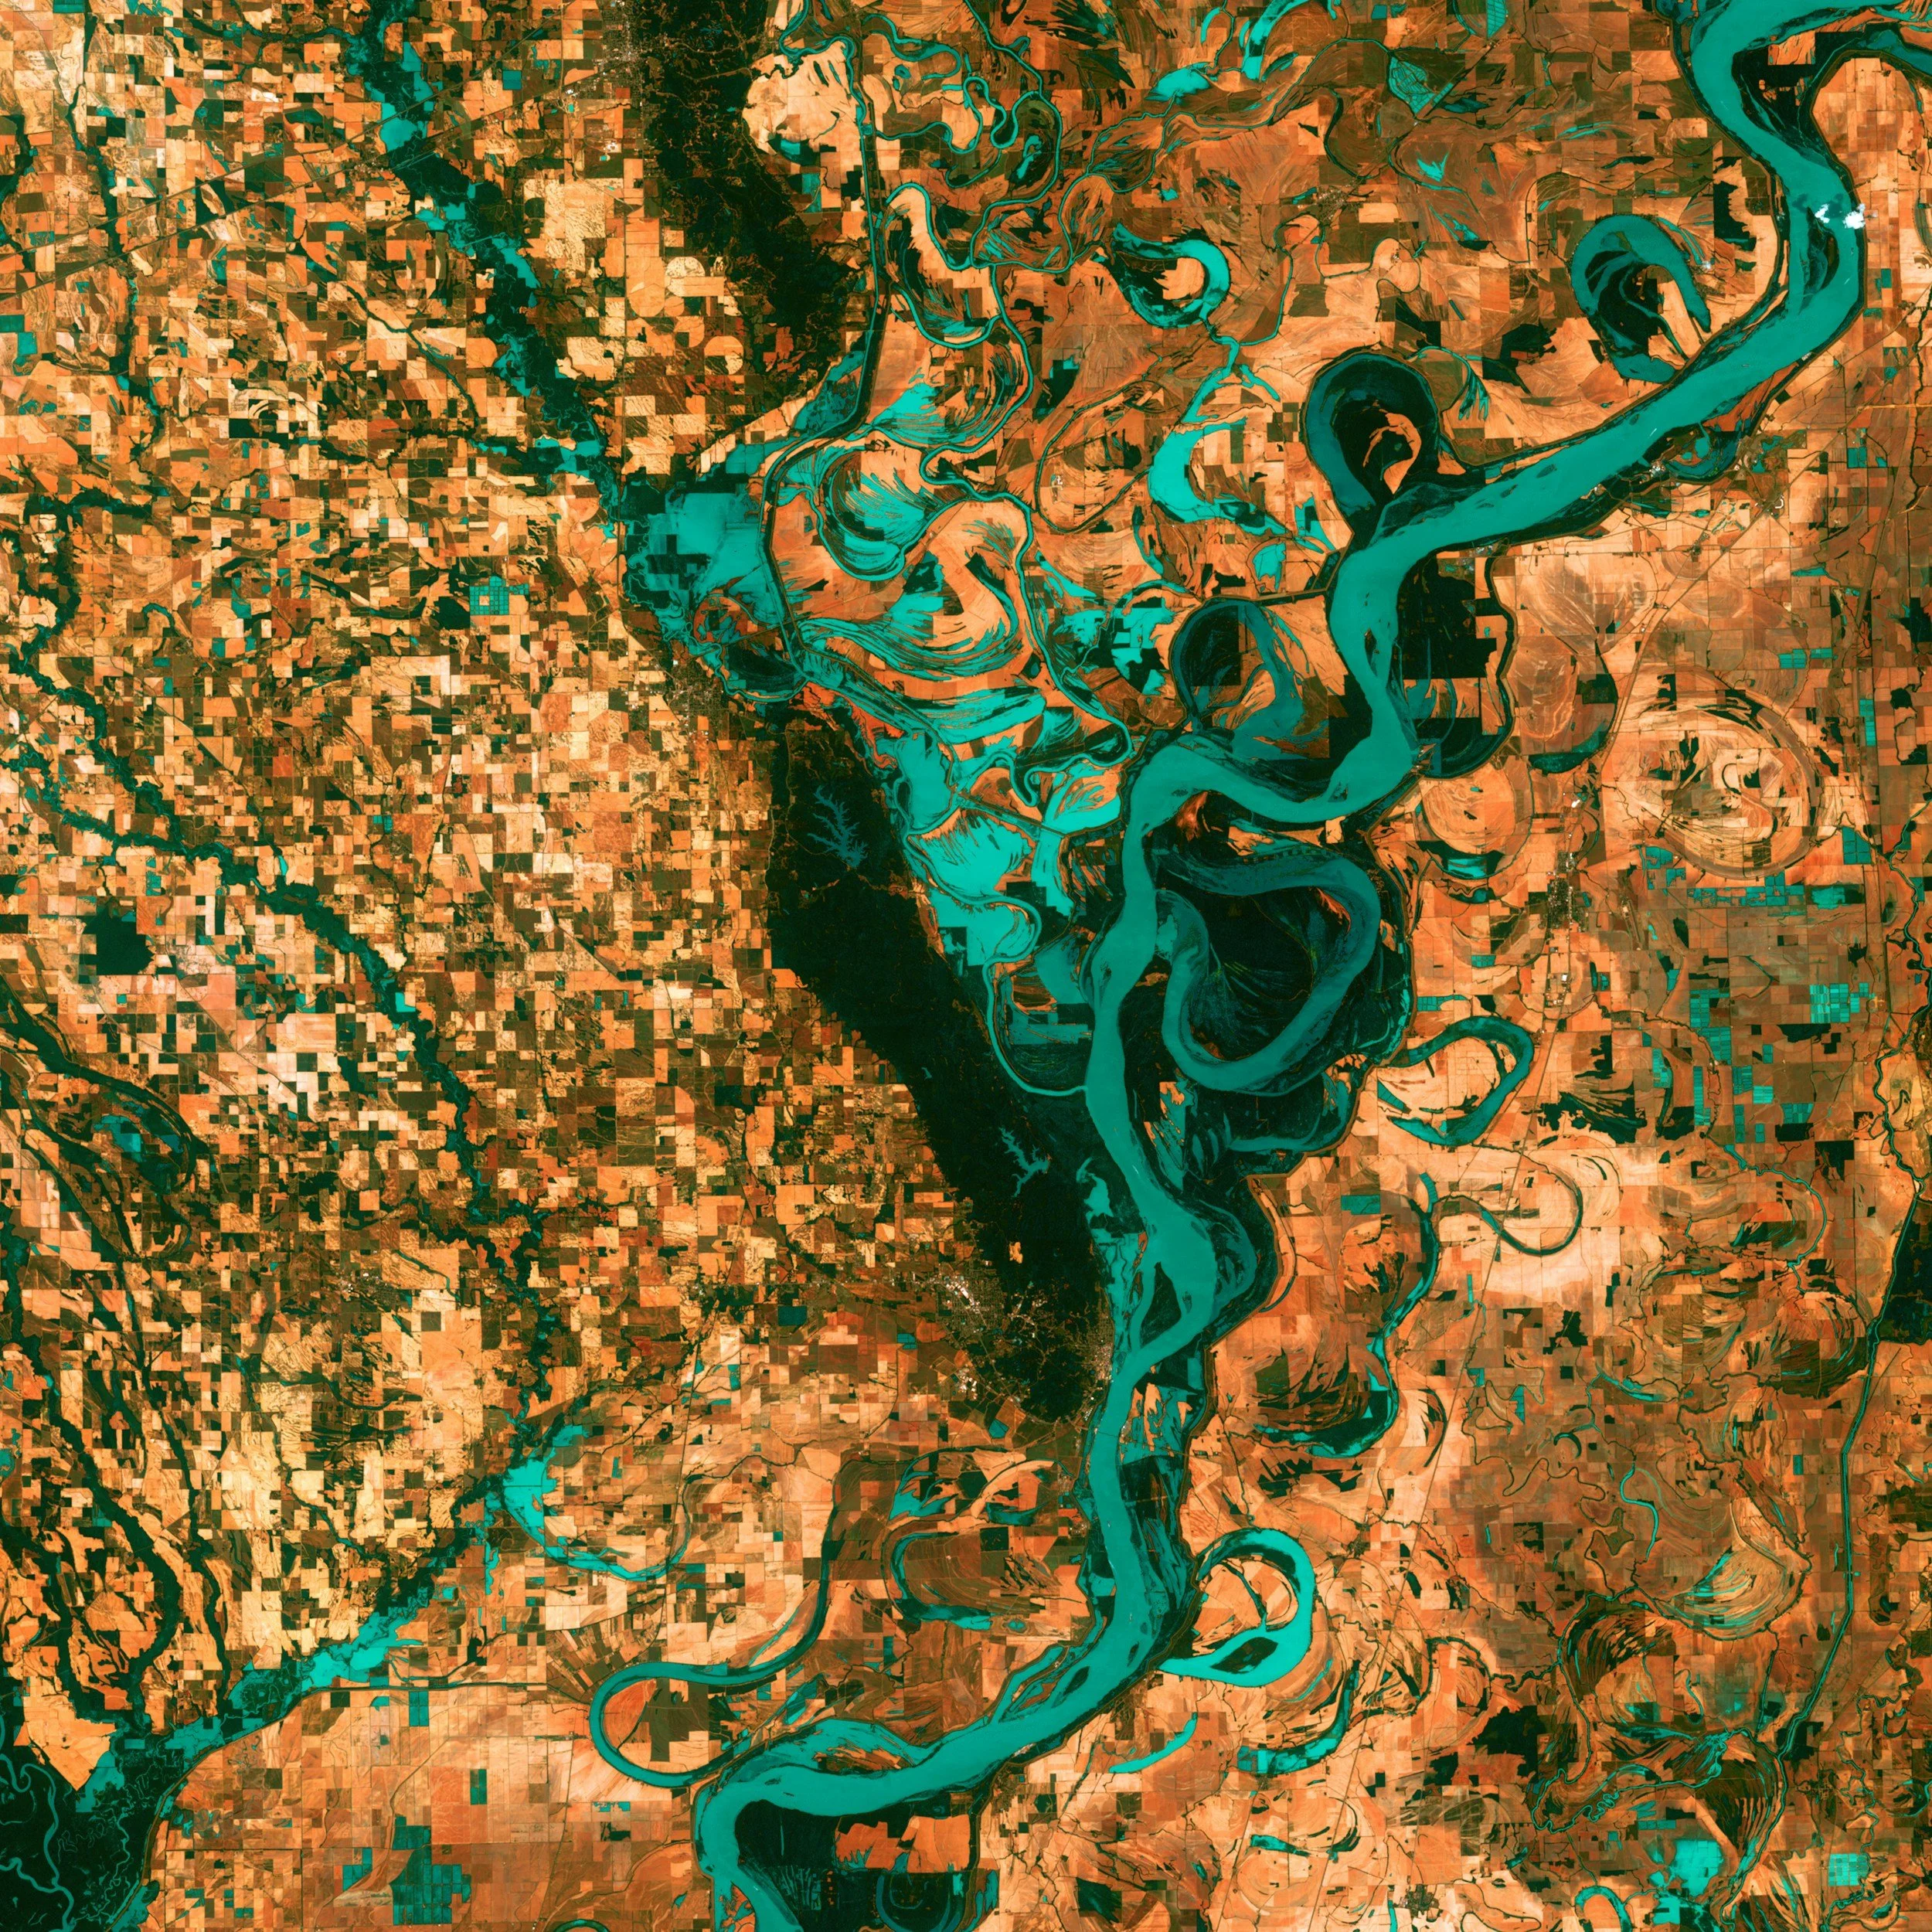
Earth Observation
Earth observation lies at the heart of our technology so we continually seek to incorporate the latest passive and active remote sensing data into our workflows.
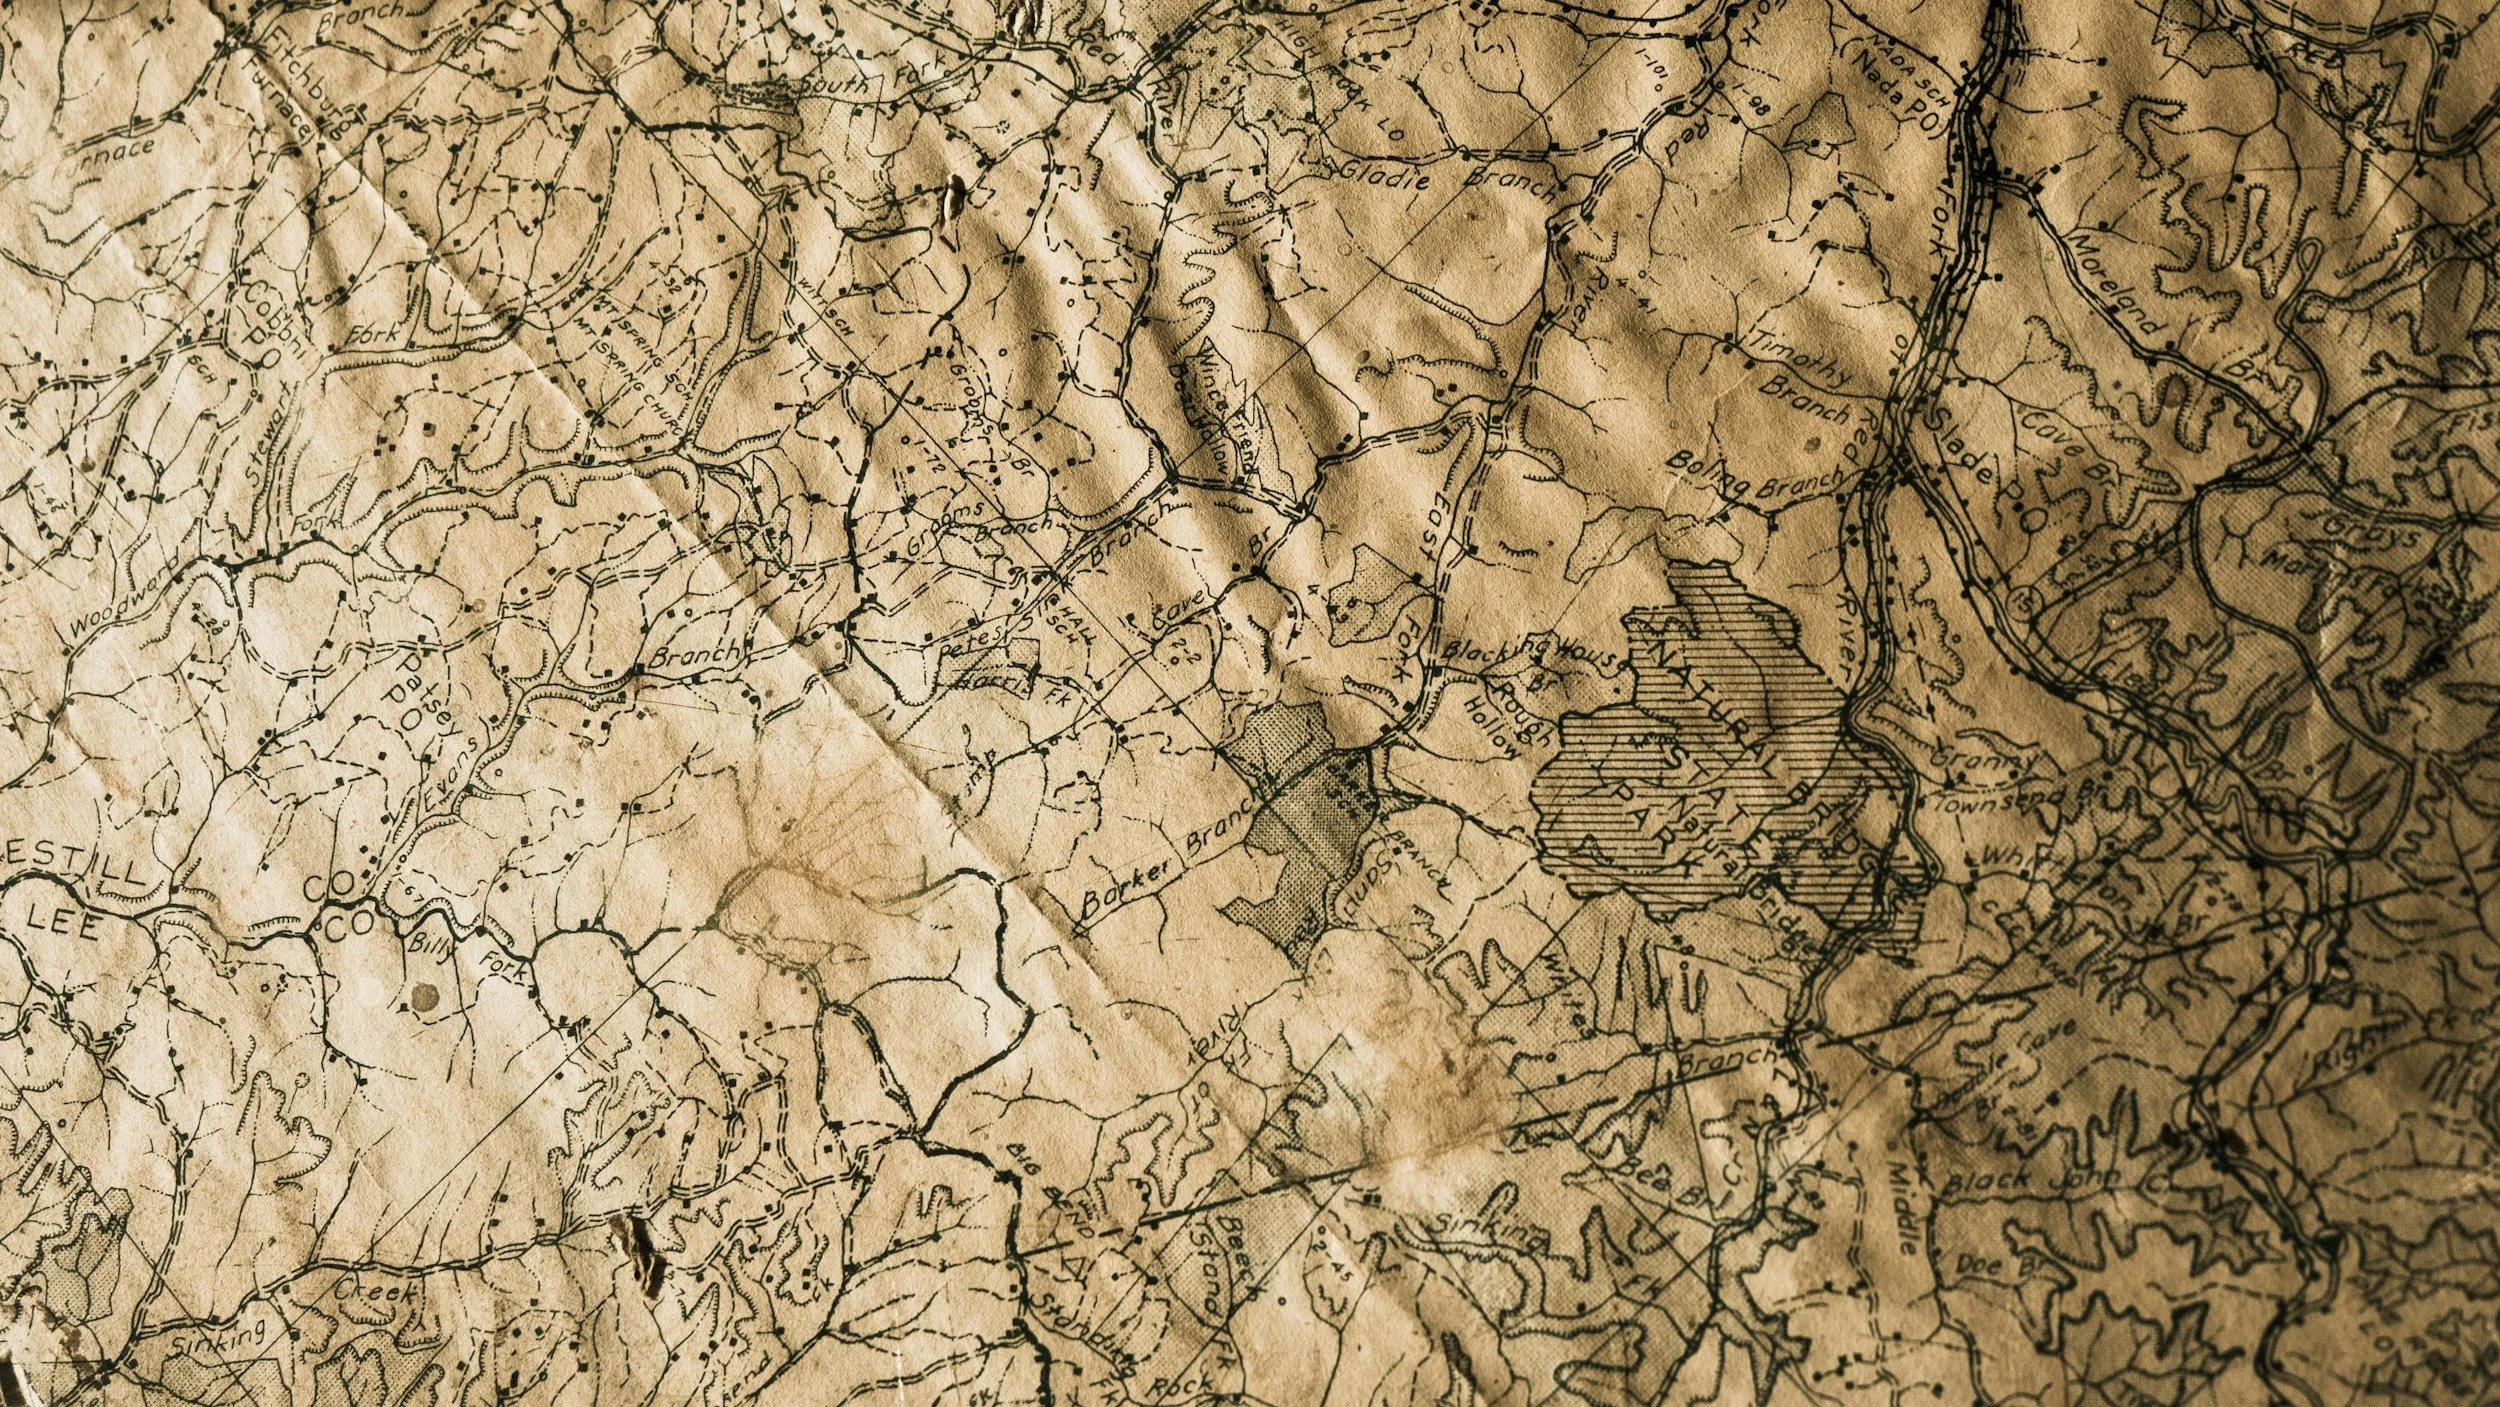
Geographic Information Systems
We provide our data in a format adapted to suit your business needs.
Our datasets are assessed using transparent, objective methodologies.

Machine Learning & AI
Our proprietary machine and deep learning algorithms generate pixel level, wall to wall information with high spatial and temporal resolution at a national scale.
Use Cases

Forest History & Validation
Reconstruct harvest and thinning events across space and time
Validate management claims and improve transparency
Support due diligence with independent, defensible data

Asset Benchmarking & Strategic Insights
Compare timberland parcels across ownerships or regions
Identify underperforming tracts and quantify investment returns and profitability
Reveal off-boundary activity for HBU and competitive positioning

Environmental & Carbon Intelligence
Refine carbon baselines and disturbance regimes
Integrate biodiversity overlays for ESG and MRV workflows
Quantify forest condition for sustainability reporting
Our Data
-
![Landscape wide metrics, forest stands]()
Forest Extent
Mapping forest stands and boundaries.
-
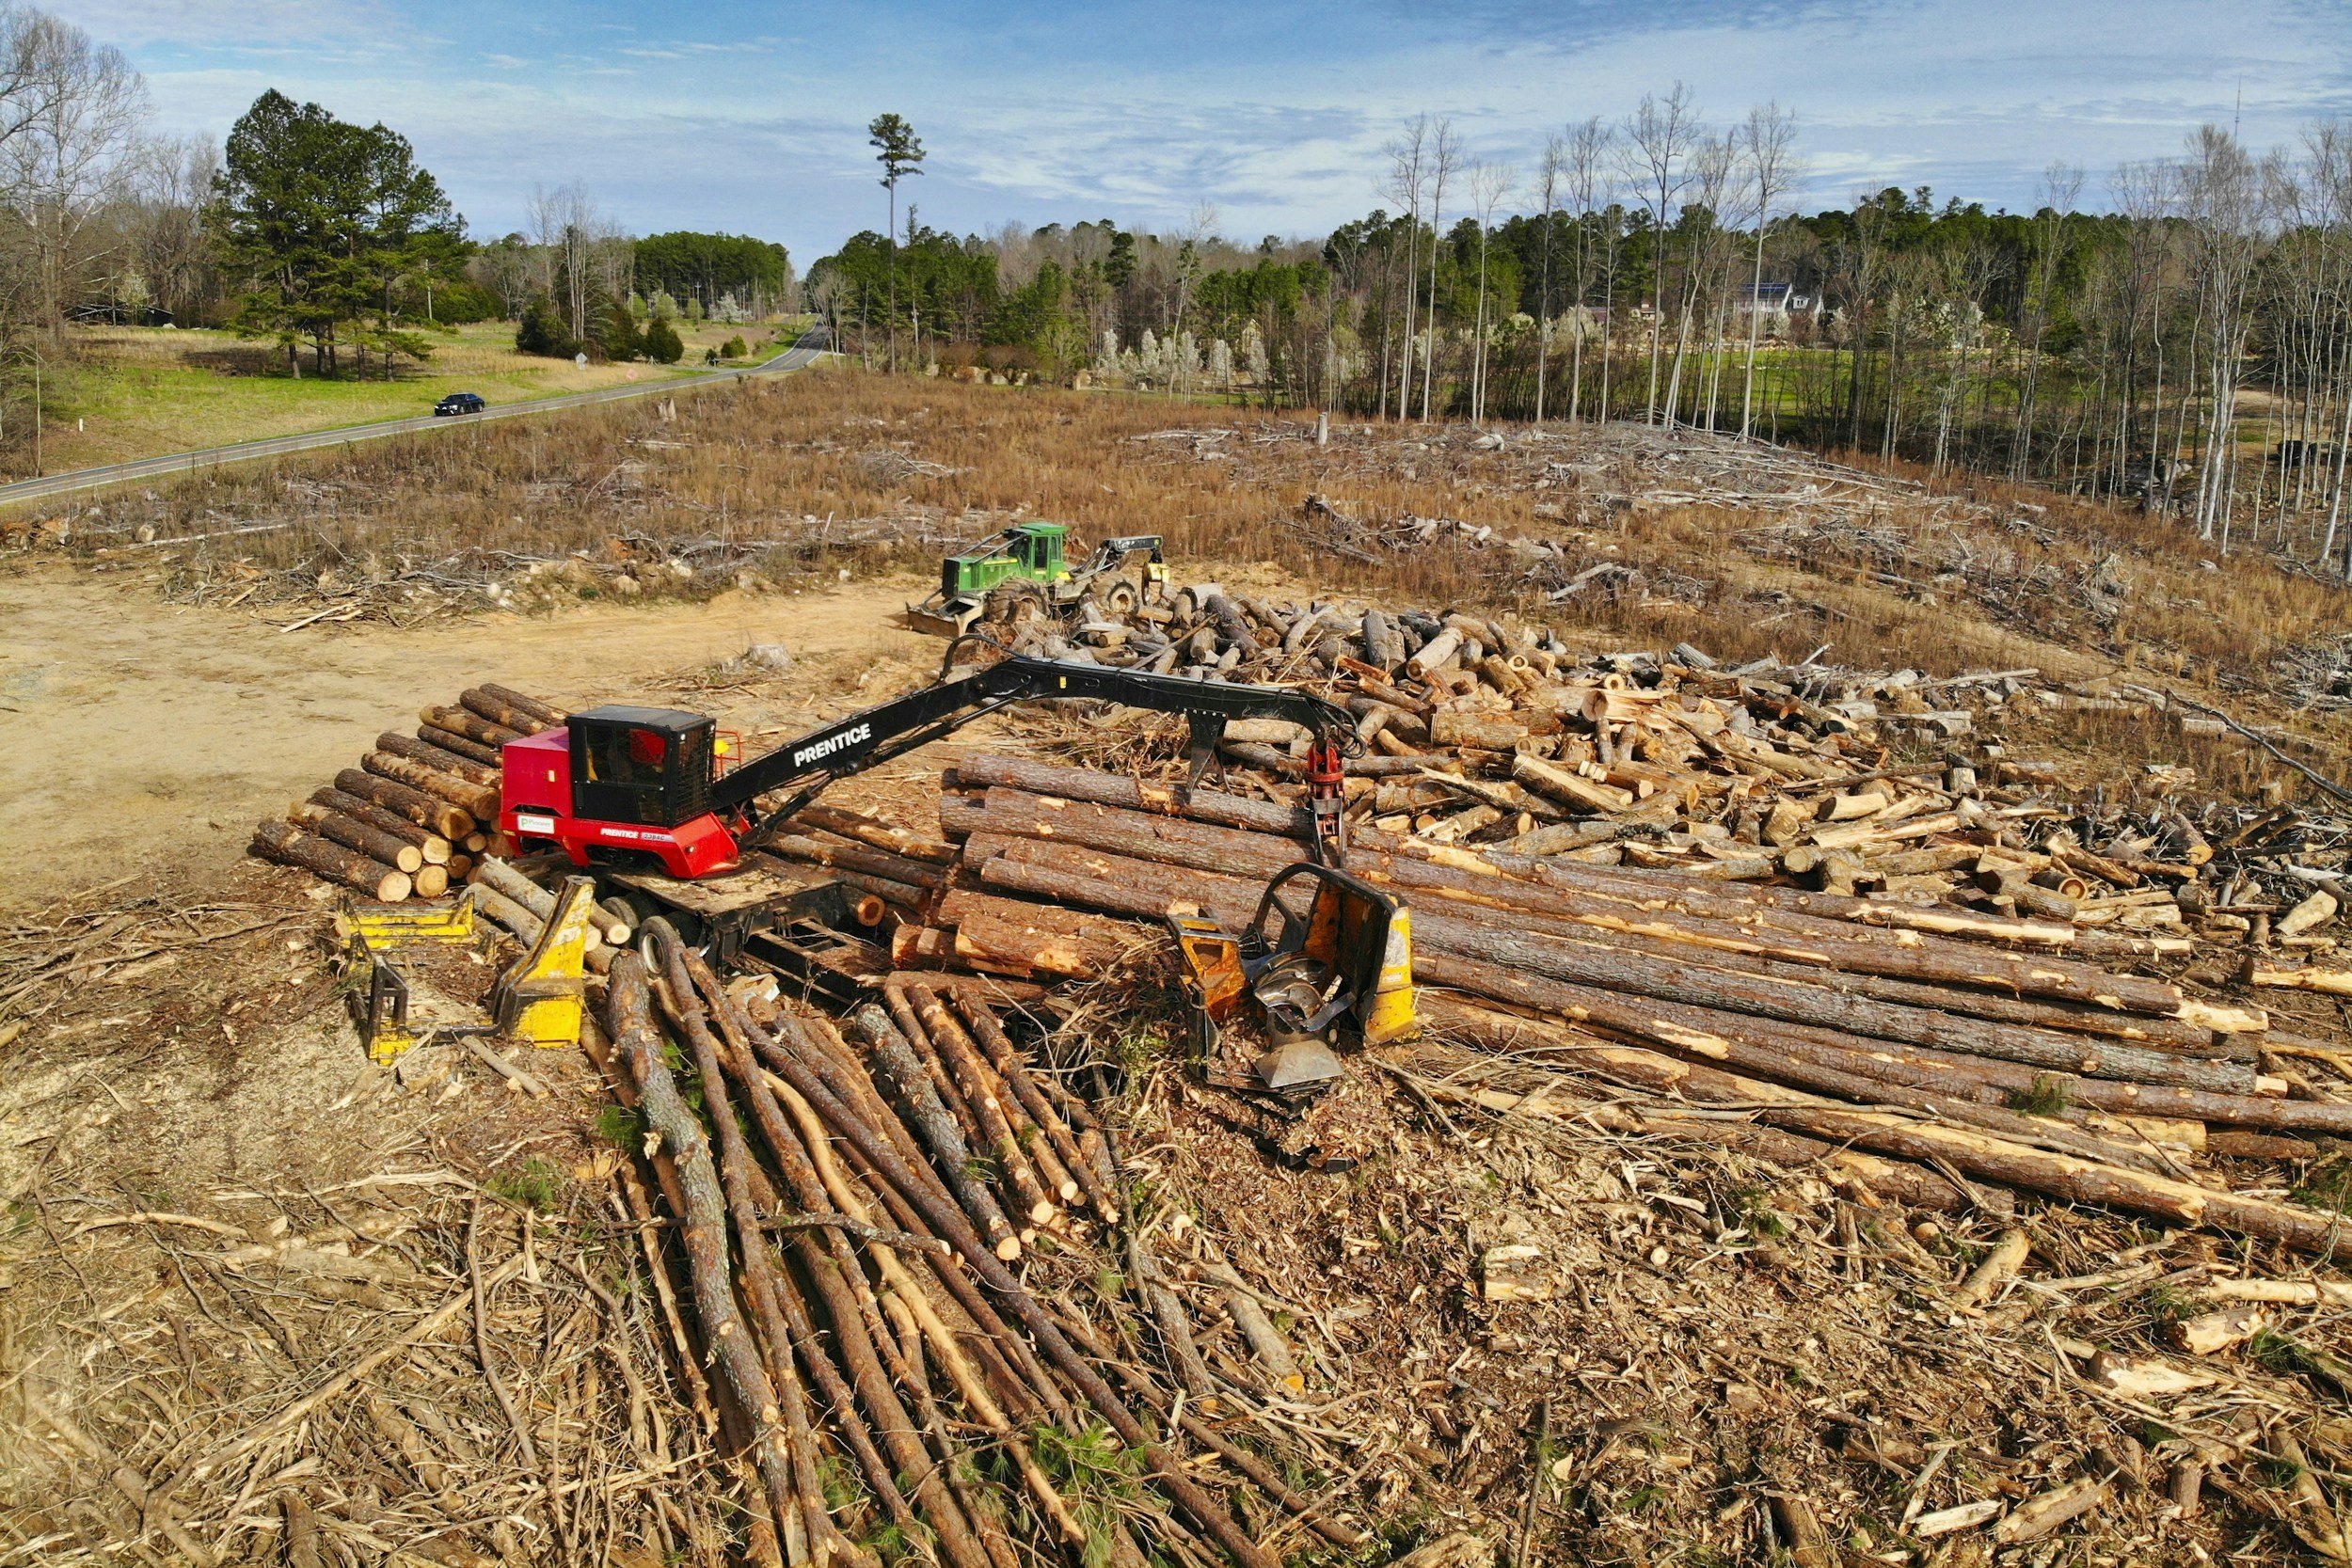
![Forest clearfell, harvest operations]()
Clearfell Harvest
40 year records of commercial forest activity including harvest year, standage, and forest class.
-
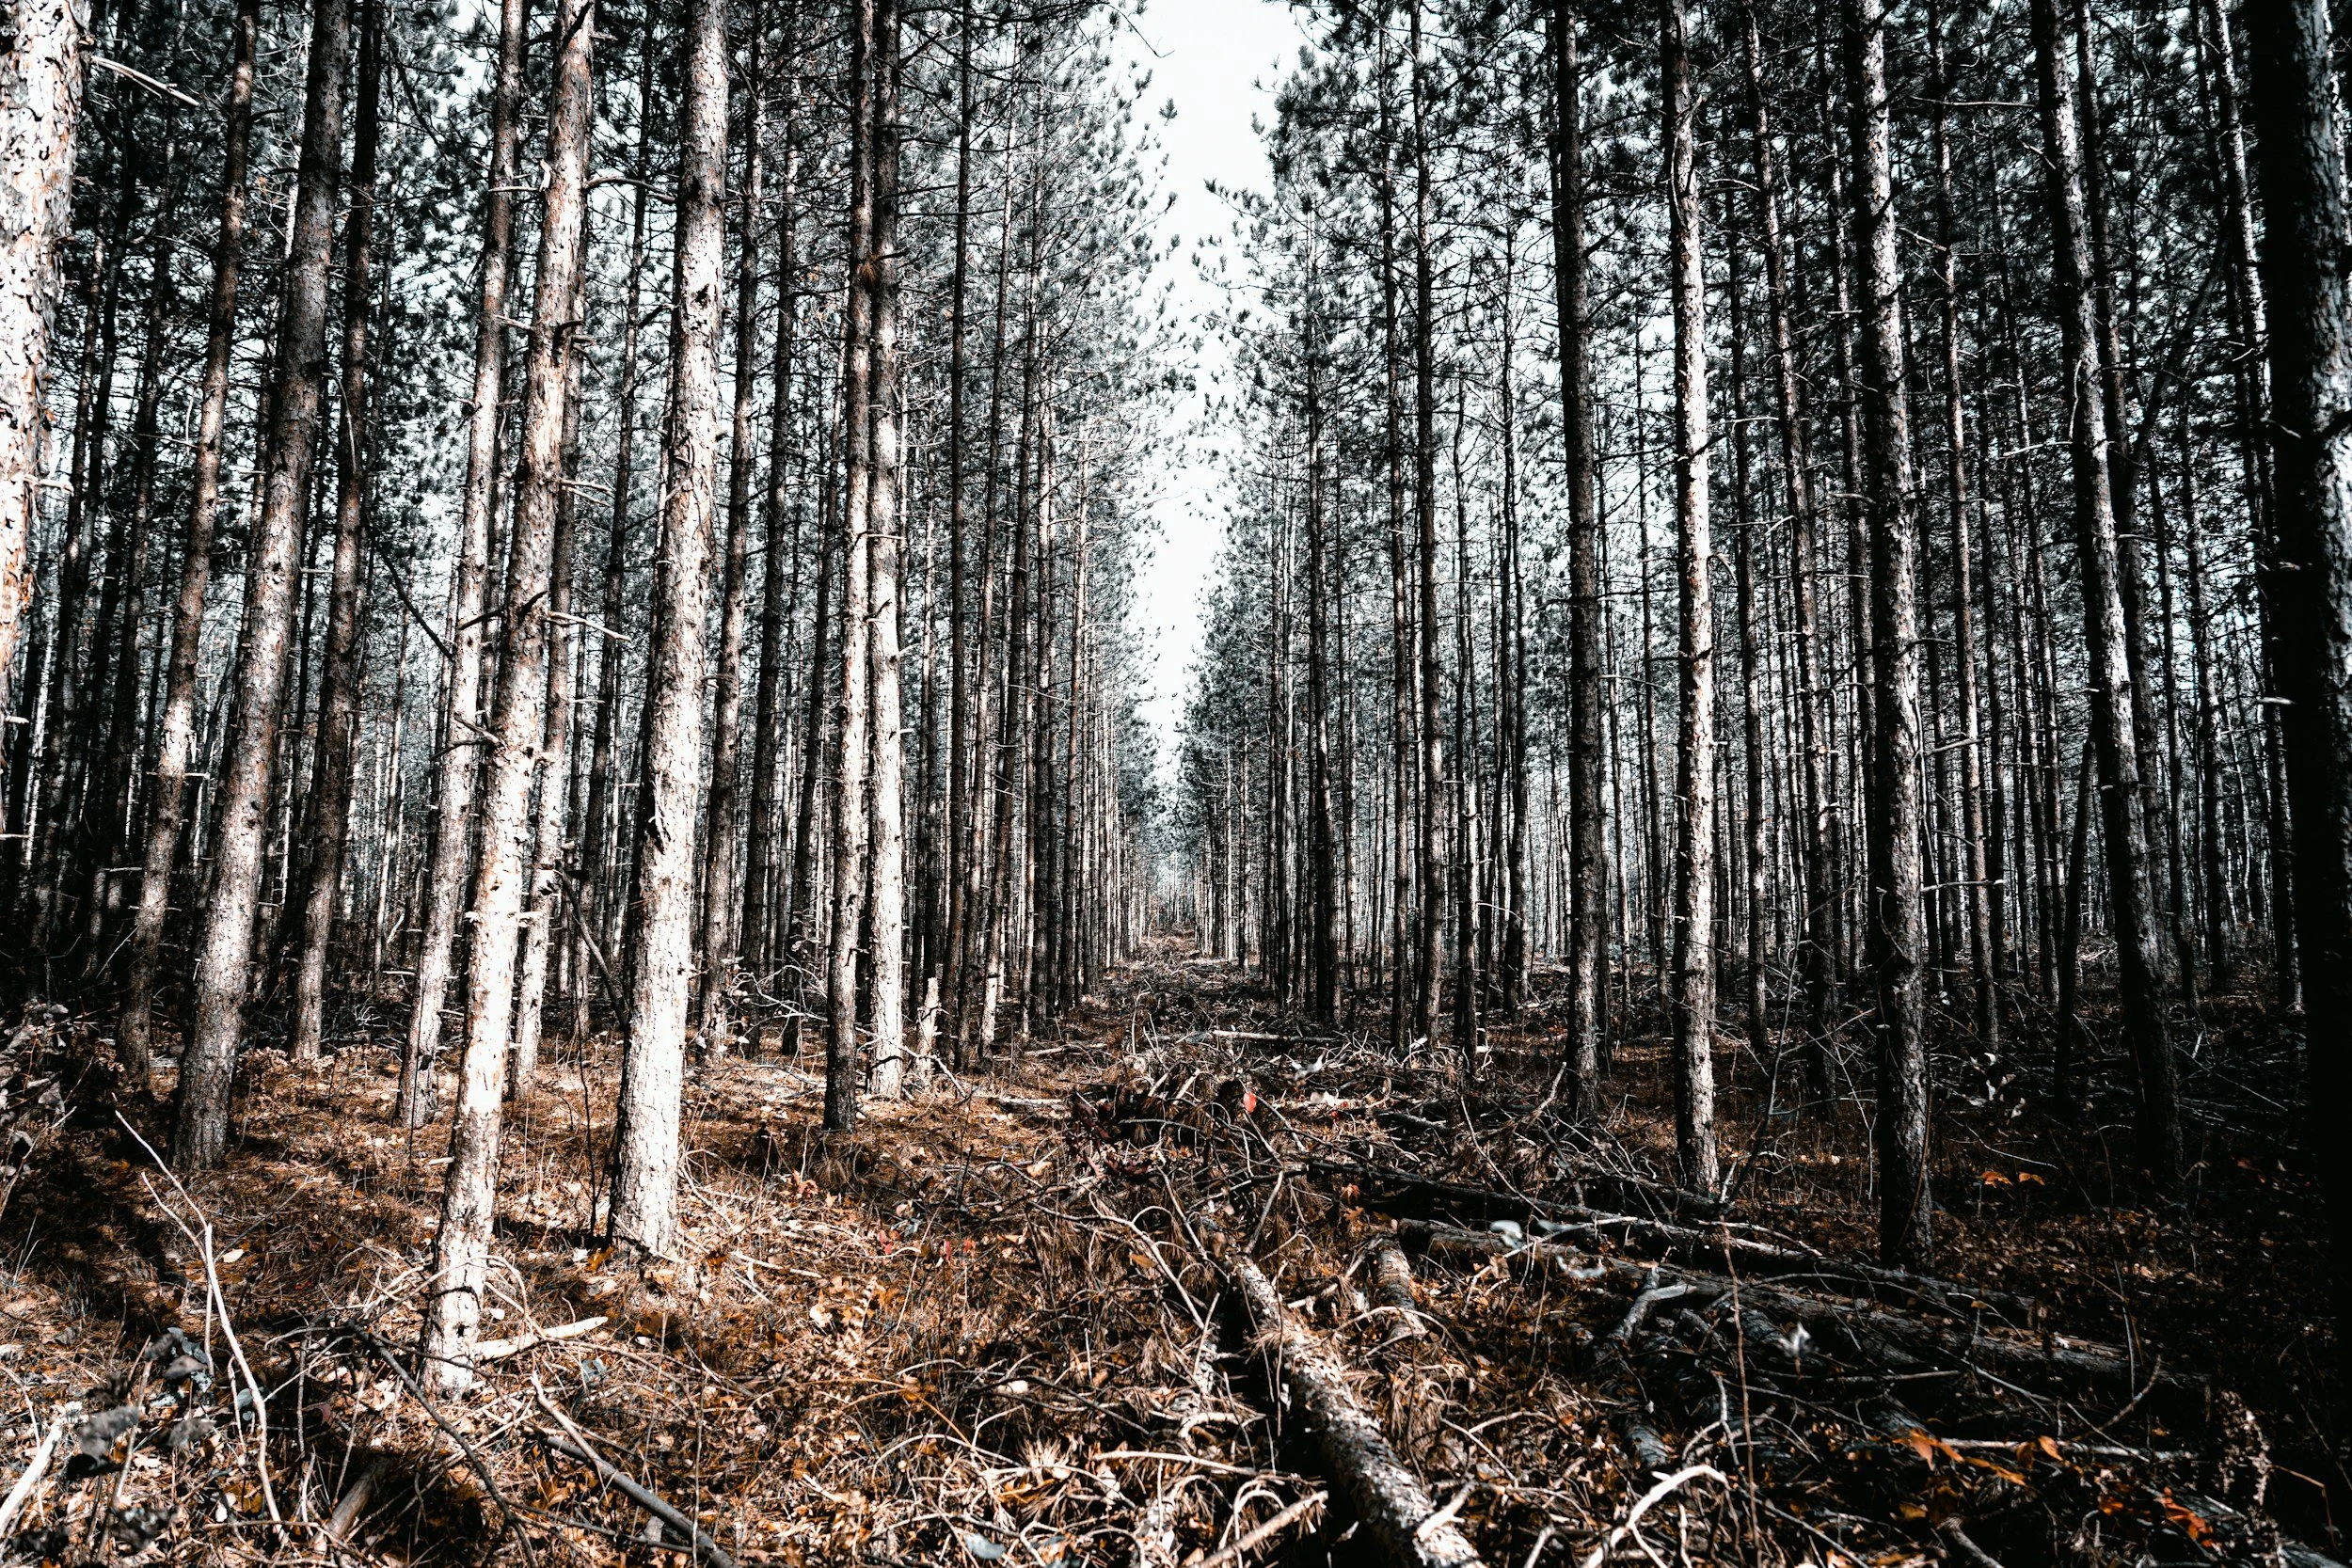
![Thinning history]()
Thinning Events
Distinguish between full and partial harvest events to fully understand tree removals over time.
-
![Forest environmental damage, pests and diseases, needle blight, beetle damage, wind blow, fire damage]()
Environmental Damage
Identify forest damage caused by environmental factors such as disease, pests, wind blow, and wild fire.


Our Product - ForestTrace
Our flagship product ForestTrace is your window into forest history — built to decode what’s happened, where, and when. Whether you're managing timberland, evaluating carbon potential, or benchmarking biodiversity, ForestTrace helps you trace harvests, thinning events, and land use changes with precision.
We combine satellite data, remote sensing, and proprietary AI models to reconstruct forest activity across space and time. Wall to wall information provided in fifteen layers detailing stand age, type and thinning along with historical harvest activities. No guesswork — just defensible, quantified insights that support smarter decisions.

ForestTrace example
ForestTrace provides quantifiably accurate results at 30m resolution and a more comprehensive picture of the forested landscape compared to benchmark industry datasets. Alternative datasets commonly misidentify thinning as felling, do not have as long a history, and capture less detail of how historical events have shaped the current landscape. This can be seen in the animated image shown here.
Download and explore a sample of our data below or contact us to find out more and enquire about bespoke solutions to suit your geospatial needs.
The results of ForestTrace were compared to two other industry benchmark datasets by comparing how much the datasets deviated from one another. The above shows within tolerance areas (+/- 2 years) in green, moderate deviation (+/- 3 years to +/- 10 years) in yellow, high deviation (> +/- 10 years) in red and missing data in blue.